Customer service is a critical aspect of business across industries to retain existing customers. Customer service involves helping customers to use the product effectively, responding to potential queries about the product, and finding solutions as quickly as possible.
Customer support is essential to your company's success since it maintains consumer relationships and increases their lifetime connection with your brand. By offering superior customer service, companies recover client acquisition expenses and establish a strong clientele that recommends other consumers and gives valuable testimonials.
To keep improving in this field it is important to monitor the most important customer support metrics that show your performance based on your customers’ experience. Without monitoring performance you will have no way of knowing how effective your customer support is, hence how satisfied your customers are. Thanks to these measurements you can redirect your efforts towards a more effective customer experience.
In recent years, customers have become more demanding and increasingly self-reliant. It is important to keep up with their expectations to build a trust relationship and retain them. This underlines the need for businesses to seek out the most important customer support metrics.

Benefits of excellent customer support
The potential benefits companies can obtain from providing a high level of customer service include:
1. Increase customer retention
According to the Bain & Company survey, increasing client retention by 5 percent may result in a 25% to 95% boost in earnings. This is because existing consumers are likely to spend 300% more on your business compared to new customers, resulting in lower operational expenses for your company with higher profit.
2. Satisfied Customers Recommend More than the Other Customers
Esteban Kolsky, a customer experience executive, estimates that 72% of consumers will tell six or more people about a good experience. In contrast, 13% of dissatisfied customers will tell 15 or more people about their bad experiences.
When customers are satisfied they are incentivized to promote your product and spread word-of-mouth. So, try to build a customer service able to meet your customers' expectations. That way, you will gain happy customers who will be ambassadors of your brand.
3. Customers Pay More to Businesses with Excellent Customer Service
You need to know that 67% of people would pay more if you offer an excellent support service that is customer-centric. Customers value great support service and would pay more to connect with a company that provides it.
4. Your Company's Brand Image Depends on Customer Service
96% of customers reported that customer service is crucial in their preference to be loyal to a brand. Moreover, you have more significant influence over this impression via your customer service representatives. Your client relationship staff is crucial as they may influence your clients and persuade them of your advantages over rivals. Using the most important customer support metrics, you can also measure your team's performance.
Measurement of the Performance of Customer Support
Measuring the performance of the most critical customer support metrics is vital for your company to keep evolving in customer support. However, proper measurement of customer-centric service performance is not as easy as it might seem and requires expertise and knowledge in the field.
When considering how to assess customer service in your company, you will quickly realize that there are many key attributes that you need to take into account and therefore you might be interested in measuring. In addition to that, it has been shown that focusing on one subject at a time may cause large blind spots. In this article, we will present and describe the most important customer support metrics to make it easier for you to measure your customer support performance.
10 Most Important Customer Support Metrics
First, it is important for you to know that there are two types of customer support metrics: operational metrics and organizational metrics.
- Operational Customer Support Metrics measures the performance of your customer service representatives. With the help of these metrics, you can easily find out what problems came across and how many got resolved.
- Organizational Customer Support Metrics are essential to understanding how your clients think about your products or services. These metrics help you to measure the level of satisfaction of your customer.
Let's explore the 10 most important customer support metrics that fall into the earlier categories.
1. Customer Retention Rate (CRR)
Customer Retention Rate (CRR) is the percentile of current customers that remain clients at the end of a particular time. Monitoring the customer retention rate is essential since statistics show the importance of having a loyal clientele. There is a 60-70% chance of selling your products to your existing customer than 5-20% to a new prospect. Customer retention is not an easy task as it requires meeting their expectations from time to time. As per MARKINBLOG, companies lose around 1.6 trillion dollars if their customers seek services elsewhere.
To increase your CRR, you should definitely focus on enhancing your customer experience. In addition to that, a good strategy could be to introduce a subscription model, if possible. Statistics have shown that if you can convince a user to subscribe to anything, you have a decent probability of retaining them in the long run. This is what Amazon did precisely, and it generates more money from the subscription fee while also boosting the likelihood that the subscriber would retain for a long time.
How to measure the CRR
To calculate the CRR, you can follow an easy formula:
CRR = (E-N)/S X 100
In this formula, E stands for customers you have at the end of the period you are considering, S stands for customers at the start of the same period, and N represents those who are present when the calculation is being done.
To understand the formula of the metrics for customer service better, take the example: You have 150 customers at the beginning of a month, and in that same month, you lost 10 customers and gained 20 new customers.
Per the formula, you have 160 customers at the end and 150 customers at the beginning of the month. Then, CRR will be 160-20/150*100 or 93.33%. A customer support team should aim for as high a score as possible.
Benefits and limitations
When focusing on improving your customer retention rate, brands will get more word-of-mouth referrals. However, there is also a potential risk that a business may overlook new customers to satisfy its current clientele.
2. Customer Satisfaction Score (CSAT)
Customer Satisfaction Score (CSAT) is a standard key performance indicator you must monitor closely because it mirrors your performance in terms of customer support. In other words, the fact that your customers are satisfied with the experience you offer is a sign that your support service is working well.
The CSAT is one of the most important customer support metrics because it gets you to an understanding of how satisfied your customers are. However, satisfaction is subjective, and its measurement is not as easy as it seems.
How to measure the CSAT
Customer satisfaction scores can be obtained by first asking your customers to fill out a survey form where they provide their ratings based on their experience. For example, the parameters can be any of these, such as 1-3,1-5, or 1-10.

A good way to gather the data needed to calculate the CSAT is to ask customers how satisfied they are with customer service after every interaction.
The CSAT can be then calculated by using this formula:
Number of satisfied customers / Number of Survey Responses X 100 = % of satisfied customers
Benefits and limitations
According to Forrester Research, client satisfaction may increase revenue in some industries by up to 1 billion dollars yearly. When companies have high customer satisfaction scores, this will bring benefits during times of corporate crisis. This is why this metric is very important to be measured, and in case of poor customer satisfaction, to be improved by enhancing the customer experience and customer support.
On the other hand, measuring the CSAT periodically can be difficult because overly frequent survey sending might upset consumers and lead to customer exhaustion. For this reason, it might be better to send surveys each time to different customers, if possible. Another critical aspect related to this metric is that customer weariness may lead to poor response rates and decreased satisfaction ratings.
3. Customer Effort Score (CES)
Customer Effort Score (CES) is a single item indicator that measures how much effort a customer has to put to avail of your service or product. It denotes the actions that a customer has to make to get an issue resolved. The score can be determined when your customer gives ratings of their experiences.
The CES is an effective measure to understand whether your customer is getting adequate help or if your products are a good fit. When the CES is low, you should start investigating the reasons why it is so effortful for your customers to get help to solve their problems with your product.
How to measure the CES
To measure your customer effort score, you can ask your customers how much they would rate the overall service. Ask them about their experience with customer service on a scale of 1-7, where one is excellent and seven is too bad. After receiving a sufficient amount of ratings, you can calculate the average score.
Benefits and limitations
The positive aspect of CES is that it is a good indicator of the probability that your customers will re-purchase from your brand. When the CES is high, that means that customers are having a good experience and this will lead them to repeat purchases from your brand.
At the same time, this metric lacks information about the different aspects and stages of the customer experience and there is no explanation for a low score.
4. Net Promoter Score (NPS)
Net Promoter Score (NPS) is a gold standard metric to measure customer experience. The NPS gives insights into customer loyalty by measuring customers’ willingness to recommend your product to their acquaintances. This metric is based on customers’ feelings about your brand, instead of their opinion on the different interactions they have with your company.
It might be interesting to know that two-thirds of the Fortune 500 Companies have adopted NPS as one of the most critical customer support metrics. It is measured from 0-100 with a single-question survey. The higher the score, the better it is. Amazon's NPS is 62, while Apple is scoring 68.
How to measure the NPS
The NPS can be calculated with the following formula:
NPS = % of detractors - % of Promoters
For example, if 10% of customers are detractors and 20% are neutral or passive, and 70% are promoters, then the score will be 70-10=60.
Benefits and limitations
The benefits of the NPS system are several, it is user-friendly, straightforward, and associated with more significant corporate expansion. However, while it may assist you in understanding client loyalty, it does not pinpoint the particular reasons why there is a significant number of detractors.
5. Customer Churn Rate (CCR)
As the name suggests, Customer Churn Rate (CCR) is the opposite of customer Retention Rate. In this measurement, you look at the number of lost customers instead of calculating how many you have retained.
Monitoring the customer churn rate is important because once a customer turns his back, getting him back on board is almost difficult. Furthermore, he may alert other customers about your products or services and warn them not to avail of your service. This is also dubbed customer attrition and it can harm the business growth in the long term.
How to measure the CCR
Customer Churn Rate is calculated with this formula:
(number of lost customers / total customers at the beginning of the month/year) x 100
So, if you had 200 customers at the beginning of the month and lost 25 by the end, your Customer Churn Rate will be 25/200 X 100= 12.5% in that period.
An acceptable Churn Rate is between 2% and 8% if your business is a B2C SAAS business or, in general, the lower, the better.
Benefits and limitations
The advantage of using the Churn rate is that it gives you a good indicator of the happiness and satisfaction of your customers. When the churn rate is high, that means that customers are not happy with the experience or product you are offering them and therefore they stop doing business with you.
On the other hand, the customer churn rate does not offer information on the categories of clients leaving the company. For example, you cannot determine whether the customers who are leaving are new or existing ones. If you could determine which categories the consumers who leave the brand belong to, it would be easier to identify the reasons for their departure.
6. First Call Resolution Rate (FCR)
First Call Resolution Rate (FCR) measures how well the call center handles customers’ problems on the first call. Customers like to get their problems fixed at the initial point of contact and dislike being passed from agent to agent.
With this critical customer support metric, you can figure out the percentile of customer issues resolved on the first go through the mail, phone call, live chat, or video call. A higher first-call resolution rate is essential to increase customer satisfaction. This improves customer retention by reducing the inconvenience of seeking help. About 93 % of customers who get exceptional customer service are more inclined to re-purchase from your brand.
How to measure the FCR
To measure the First Call Resolution rate you can use the following formula:
FCR = Cases resolved on the first time or cases handled by agents X 100
For example, if 200 calls were resolved on the first call out of 400 calls, the FCR will be 200/400 X 100=50%.
Benefits and limitations
This metric is a good representation of how good your customer service is when dealing with customer queries. However, there is no method to determine the causes of a poor FCR to then try to improve it.
7. Customer Ticket Request Volume
Ticket Volume monitors the number of tickets in your support queue over time. This is a crucial measure that should always be monitored to be able to meet the demand for support of your customers. Notably, you can determine client demand by measuring the ticket volume, then using historical data and cyclicity to predict future demand.
Even if customers engage with your company and you have a functional ticketing system, getting overwhelming requests may indicate a problem. Suppose you have an excessive number of tickets. In that case, you must hire extra customer support agents or explore a potential UI/UX problem.
How to measure the Ticket Volume
Examine the number of support tickets from one month to the next or from one week to the next. When a new product or feature is released, you should pay extra attention to whether or not the number of tickets increases.
You can monitor email support, help center, Facebook, and Twitter tickets from a CRM-based platform.
Benefits and limitations
The Ticket Volume gives an overview of the customer support team's workload that can be useful to identify the need for the adoption of a more efficient system or the recruitment of new employees. At the same time, since nowadays companies offer support through a wide range of different channels, it might be difficult to record all the interactions.
8. Average Ticket Handling Time (AHT)
Average Ticket Handling Time(AHT) is a measure that represents the average time required to address a support or service request. This includes time spent on customer holds, delays, and follow-up activities.
AHT is one of the best KPI customer services as it will help you understand how customers interact with your brand. Handling time represents the exact amount of time an agent spends on a particular case. The shorter the duration, the more productive your team is.
How to measure the AHT
You can measure the Average Ticket Handling Time by using this formula:
AHT= Total talk time + Total Hold Time + Follow-Up Time
For example, your team had 250 calls this week, the total talk time is 2000 minutes, the hold time is 750, and the follow-up time is 500. Therefore, your team's AHT will be 2000+750+500/250=13.
Benefits and limitations
The average handling time offers a unique perspective on how fruitful your customer support and service engagements are. At the same time, it may lead to erroneous conclusions if not applied effectively since it is not considered the cause of the eventual prolonged handling time.
9. Frequency of Up-Selling and Cross-Selling
Upselling refers to the practice of selling a more expensive alternative to customers. On the other hand, cross-selling refers to the practice of selling a complementary product or service that integrates the primary offering.
When upselling and cross-selling rates are high, that means that your customer support team is doing very well in the sense that they are effectively persuading clients to purchase more. That is why it is one of the most important customer support metrics you need to pay attention to if you want to effectively measure the performance of your customer support team.
Amazon is the perfect example of upselling and cross-selling. When you add an item to your Amazon shopping bag, it offers additional things using words like 'You may also be interested in' or 'Most customers purchase these products together.' The suggested goods are connected to cross-selling. On the other hand, Amazon Premium upsells without interrupting the user experience.
How to measure the up-selling and cross-selling rate
You can measure the up-selling and cross-selling ratio by calculating the average sales volume for each customer, or alternatively, by determining the number of products sold to each individual. When these numbers increase, that means that your team is successfully up-selling or cross-selling.
Benefits and limitations
As already mentioned, being able to monitor up-selling and cross-selling activities is important to understand whether your customer support is doing good or not. If your support team is doing a good job, the up-selling and cross-selling opportunities usually increase.
At the same time, you need to take into account that frequent up-sells or cross-sells may make buyers consider a firm overly promotional, damaging confidence in the company.
10. Customer Lifetime Value (CLV)
Customer Lifetime Value (CLV) is the total amount a customer will spend on your company or products in their entire life span. CLV enables you to determine how much money should be invested in onboarding new consumers and maintaining relationships with current clients.
How to measure the CLV
CLV can be determined through the following formula:
CLV = average value of transaction X frequency of purchase X standard customer lifespan
An example to understand: client 'A,' who often buys shoes from your shoe store, may be worth the following: $ 80 per pair of shoes X 2 pairs per year X 6 years = $ 80X2X6 = $960
Client 'B' is an athlete who buys shoes that may be worth: $ 120 per pair of shoes X 4 pairs per year X 8 years = $ 120X4X8 = $3840 From the calculations and the scores obtained, it is clear to whom you will provide more attention.
Benefits and limitations
Customer Lifetime Value provides an opportunity to make plans for scalability. CLV it’s a metric that enables you to evaluate whether you’re able to scale or not in the future. It helps you estimate future revenue and measure long-term company success.
However, even with accurate statistics, CLV is hard to forecast because it depends on customer behavior, and should not be considered an absolute number.
How can Layerise make your customer support performance skyrocketing?
Layerise strives to help your brand provide industry-leading customer support services. The platform works as a bridge between your product or services and your customers. To keep up with the challenges of every day, Layerise offers a unique blend of tools to enhance your customer experience, with data collection and marketing so you can forge ongoing relationships with customers and create continuous revenue streams.
Moreover, thanks to Layerise you are able to collect precious data about your customers that can help you assess the most important customer support metrics. Hence, Layerise can not only enable your company to offer the best customer support services but also measure performance in order to adjust accordingly and improve the experience you are offering to your customers.
If you want to learn more about how Layerise can help your business, book a free demo with us now!
Learn how to collect valuable insights on your customers to sell even more.

How to Turn a New Obligation into a Growth with Layerise

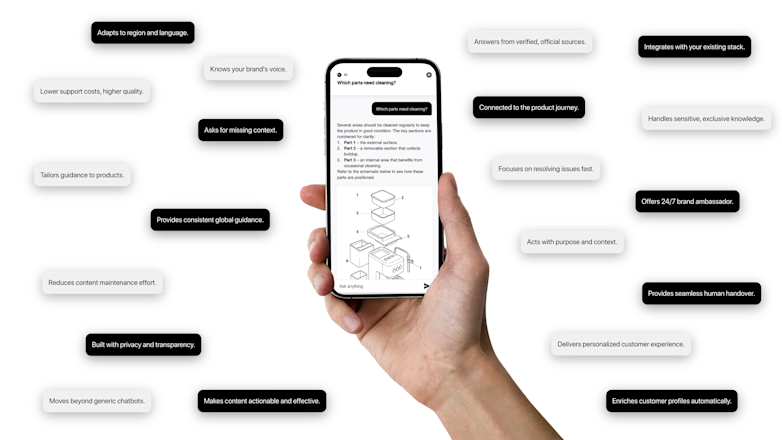
A trusted, brand-safe AI assistant that knows your products, your customers and your content.